Data literacy for AI: the skills to check an answer before you act
Try it · 30 seconds · from Atterna’s practice
| week | paid orders |
|---|---|
| 1 | 2,625 |
| 2 | 2,751 |
| 3 | 3,289 |
| 4 | 406 |
Orders fell 88% in week 4. What happened?
Preparing the practice…
Learn the data skills you need to use AI well: define metrics, check denominators, spot misleading comparisons and verify SQL. A worked example and a free practice path.
On this page · 6
You ask an AI assistant whether a campaign worked. It gives you a chart, calculates a 50% increase in buyers and recommends increasing the budget. The calculation looks right. Is the recommendation ready to use?
Data literacy for AI means being able to define the question, understand the data behind an answer, check the calculation and judge what the evidence supports. You do not need to build an AI model to start. You do need to notice when “more buyers” becomes “a better campaign” without a fair comparison.
This guide is for people using ChatGPT, Gemini, Claude or another assistant to analyse business data. If your goal is to build machine-learning models, you will also need a different technical path: programming, statistics, model evaluation and the relevant engineering skills. Here the goal is to make a better decision with the analysis in front of you.
A correct calculation can support the wrong recommendation
Here is a deliberately small, invented example. These are complete, equal-length periods with the same visitor and buyer definitions; they are not results from Atterna users.
| Period | Eligible visitors | Visitors who bought | Ad spend |
|---|---|---|---|
| Before the campaign | 1,000 | 100 | €400 |
| During the campaign | 3,000 | 150 | €900 |
The assistant says: “Buyers increased by 50%. The campaign improved performance. Double the budget.”
The first sentence is correct: (150 − 100) / 100 = 50%. The rest needs checking.
- Conversion fell from 10% to 5%. Divide buyers by eligible visitors:
100 / 1,000, then150 / 3,000. That is a fall of 5 percentage points, or 50% relative to the original rate. - Ad spend per observed buyer rose from €4 to €6. That is
400 / 100, then900 / 150. It is not necessarily customer acquisition cost: some buyers may be returning, and some may have bought without the ads. - Profit is unknown. We have no order margin, discount cost or refund data.
- The campaign's causal effect is unknown. Before and after are different periods. Traffic composition, seasonality or another change could explain some of the difference.
These facts do not prove the campaign failed. They show why the table cannot justify doubling the budget on its own. A defensible response is: “We gained more buyers while traffic grew faster and spend per observed buyer increased. Before changing the budget, compare margins and a suitable control or experiment.”
That is the skill Atterna trains: keep the calculation, the interpretation and the decision separate long enough to check each one.
Seven data skills that make AI analysis more useful
| Skill | What to ask or check | Where to practise |
|---|---|---|
| Define the decision | What will change if this number is high or low? | Ask AI a precise data question |
| Define the metric | People or orders? Paid or placed? Which time zone and period? | Metric definition template |
| Read the denominator | Did the rate change because the numerator or population changed? | Recalculate the campaign example above |
| Recognise the unit of a row | One order, one item or one customer? Can a join repeat the amount? | SQL JOIN duplicates |
| Make a fair comparison | Are the groups comparable? Is this period complete? | The first Atterna Case |
| Reproduce a result | Can you trace it to rows, filters and a calculation? | SQL from zero |
| Communicate uncertainty | What does the evidence establish, and what is still an assumption? | Check AI-generated numbers |
AI can help with every row in this table. It can suggest definitions, flag a denominator problem and write a test query. But it needs the relevant context, and a fluent explanation is not evidence that the underlying calculation was verified.
Give the assistant the meaning, not just the task
“Analyse conversion” leaves several choices open. A more useful brief for the example is:
I need to decide whether to increase next month's campaign budget. Compare the two complete periods in this table. Conversion means distinct eligible visitors who bought at least once, divided by distinct eligible visitors. Show both counts, both rates, the percentage-point difference and the relative change. Keep observed changes separate from claims about what caused them. List what is missing before recommending a budget change.
This is more than a longer prompt. You have supplied a metric definition and a boundary on the conclusion. If the assistant chooses a different definition, you can spot the difference.
Think of it as keeping a small semantic layer in your head: what each number means, which rows it includes and which decision it can support. A company's documented semantic layer can help preserve those definitions in tools. Your job is still to check that the question and the definition match. Use the copyable metric template when the definition needs to be shared with a colleague or AI.
A practical route into the skill
You can start without SQL. Work up to the point where you can inspect the calculation yourself.
- Try the ambiguity. Wrong Number is a free, three-question game: colleagues ask for a customer count but need different populations. Select who should count. No account or SQL required.
- Learn to inspect rows. Atterna Start begins with tables, columns and a query built with the mouse. Days 1–2 are free without an account; a free account opens all ten days.
- Practise a decision. In Bigger baskets?, marketing wants to use a promo-code comparison in a forecast. Ask what the number will decide, agree on a definition, write SQL and examine whether the claim follows. Basic SQL helps; the first case is free without an account.
- Bring the habit to an answer you already have. The AI Answer Checker suggests follow-up questions. Its instant checklist runs locally; optional AI feedback requires your permission. Neither mode can certify source data it has not seen. Do not paste confidential material you are not allowed to share.
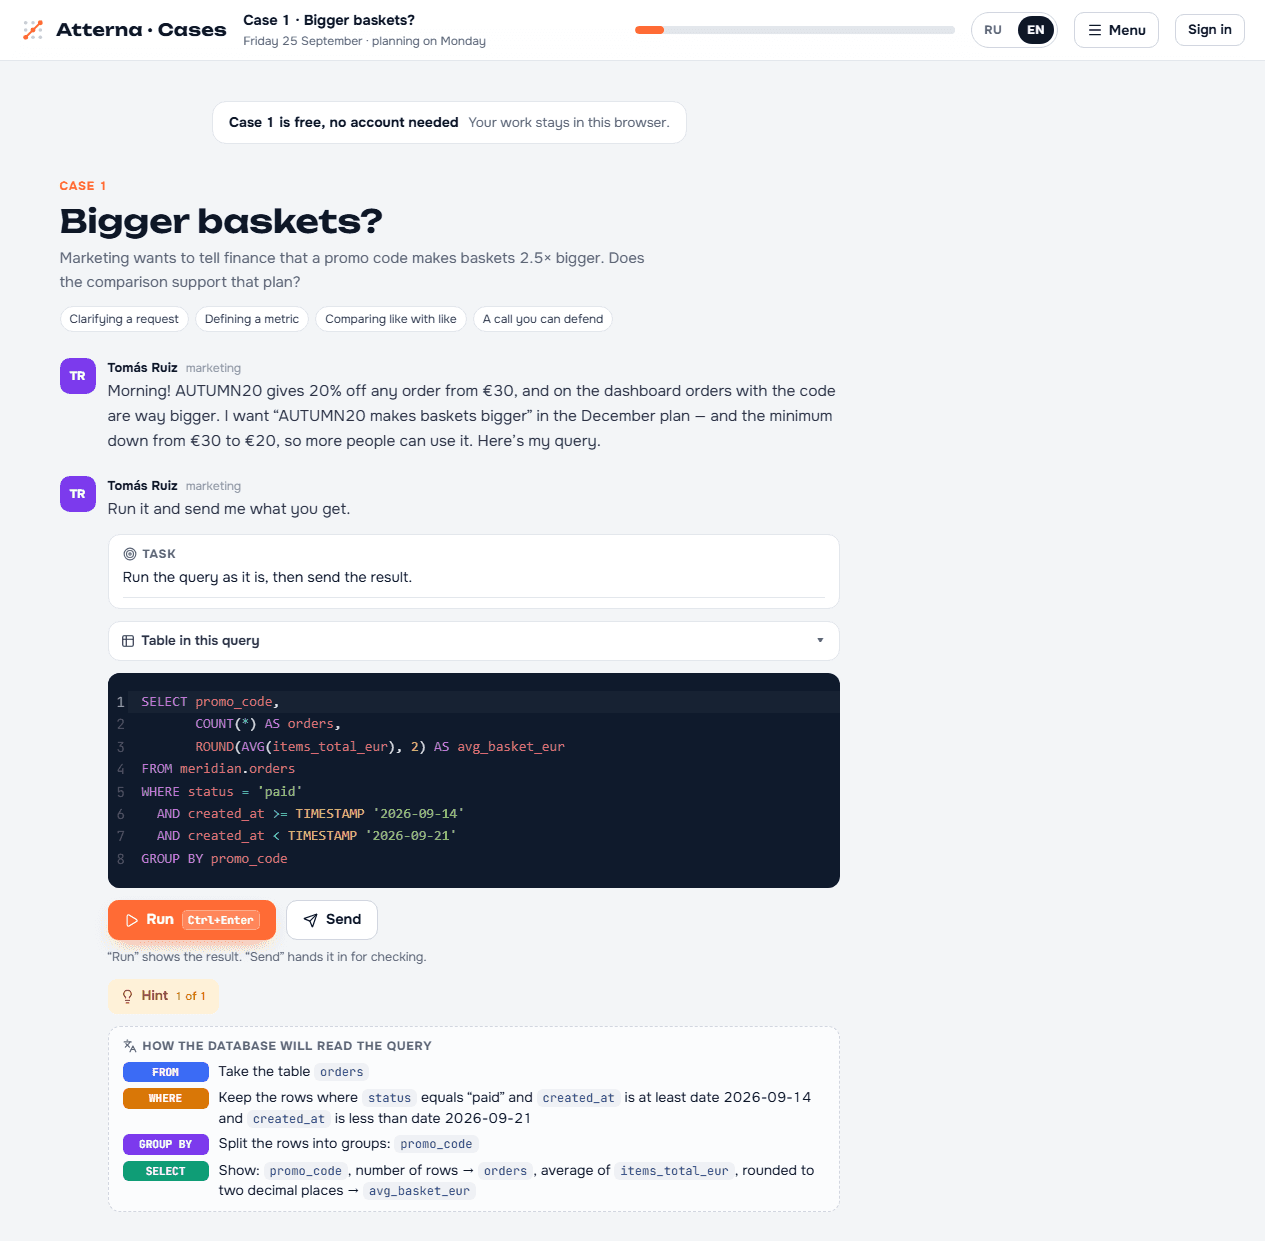
Case 1 starts with a supplied query. You inspect its comparison before deciding what the team can claim. The marketplace and characters are fictional.
You are ready for a longer investigation when you can explain the definition, reproduce the result and name a plausible alternative explanation. Meridian extends that into an analyst's workday, with checked queries and a recommendation the team can trace. It is part of Atterna Analyst (€59, one-time payment): eight episodes, each opening after the previous one.
A three-question self-check
Before reading the answers, return to the campaign table.
- Did conversion fall by 5% or by 5 percentage points?
- Does €6 in ad spend per buyer prove that a new customer cost €6 to acquire?
- What one sentence would you send instead of “Double the budget”?
Answers: conversion fell by 5 percentage points, a 50% relative decrease. Spend per buyer is not proven acquisition cost because these are not necessarily new or incremental buyers. A useful recommendation states the observed trade-off and asks for a margin comparison and causal evidence before scaling. There is no single required wording; the distinction is what matters.
FAQ
What is data literacy in AI?
It is the ability to understand and question the data behind AI-assisted work: where it came from, what a metric means, how a number was calculated and whether the evidence supports the conclusion. For business analysis, a good first test is whether you can explain a rate's numerator and denominator.
What should I learn before using AI for data analysis?
Start with tables, metric definitions, counts versus distinct people, rates, averages and fair comparisons. Then learn enough SQL or spreadsheet formulas to reproduce a result. You can use AI while learning; practise checking its output rather than treating it as an answer key.
Is data literacy the same as prompt engineering?
No. Prompt wording can help communicate a task, but data literacy tells you what to put in the task and how to check the answer. Knowing that orders and customers are different counts matters whether you work with an AI, a colleague or a dashboard.
Can I learn these skills without coding?
Yes. You can practise definitions, denominators and comparisons with small tables and a calculator. Wrong Number is a no-code starting point. SQL becomes useful when you need to inspect more rows, reproduce calculations and understand what a generated query actually counts.
Does this apply to Gemini as well as ChatGPT?
Yes. Check the same things regardless of the assistant: source, definition, time window, filters, calculation and strength of the conclusion. A second model agreeing with the first is not independent verification; reproducing the result from the relevant data is stronger evidence.
Practise this, free
A free account opens hands-on lessons on a realistic marketplace.
- All 10 days of the SQL courseFrom your first table to JOINs and window functions
- Meridian episode 1A full analyst week: the record that wasn’t
- Your first portfolio projectFinished work as a ready GitHub project, with your SQL and charts
- Progress on any deviceYour cheat sheet and review cards go with you
Examples use Meridian, Atterna’s fictional practice marketplace.