Metric definition template (with example): agree what to count before writing SQL
Try it · 30 seconds · from Atterna’s practice
Which definition lets two analysts get the same number from the same data?
Preparing the practice…
You send the number. “That’s not what I meant.” A practical metric definition template, clarifying questions and a worked conversion example to use with a colleague or an AI assistant.
On this page · 6
“How many people bought in August?”
You count the orders and send the result. “No, I meant customers. And only completed purchases. Did you include test accounts?”
You change the query. The number changes. Now nobody is sure which version went into the presentation.
The missing step came before SQL: agreeing what the number should mean. The same problem happens when an AI writes the query. A precise calculation can still answer the wrong question.
A useful metric definition says what you measure, who belongs in it, which events count, over what period, and what is excluded. Start one step earlier: what decision will this number support?
Ask about the decision before the dashboard
Suppose marketing asks, “Did people using the discount code spend more?” That could mean:
- What was the average order value in each group? A descriptive comparison.
- Did the code cause people to spend more? A question about cause and effect.
- Should we offer the code to more people? A decision that also depends on costs and who is eligible.
One comparison does not automatically answer all three. Ask: “What will you do differently depending on the result?”
Then narrow the request:
- What are we comparing? Code orders against which orders, from which period?
- What does “spend” mean? Goods value before the discount, what the buyer paid, or margin after costs?
- Who could enter each group? Did a minimum basket rule exclude small orders from the code group?
- What evidence would change the decision? Is a descriptive gap enough, or do we need evidence of the code’s effect?
“Would you like a chart?” can wait. It changes the presentation, not what the analysis must establish.
A metric definition template you can copy
| Field | Write down | Example: monthly buyers |
|---|---|---|
| Decision | What this will inform | Decide whether the August drop in buyers needs a retention push |
| Entity and key | What is counted once | A buyer account, deduplicated by buyer_id |
| Qualifying event | What makes it count | At least one completed order |
| Time window | Dates, timezone and timestamp field | Order completion time from 1 Aug inclusive to 1 Sep exclusive, Europe/Amsterdam |
| Population and exclusions | Who is eligible; what is left out | Buyer accounts only; exclude test accounts |
| Calculation | Numerator and denominator, where relevant | Count distinct qualifying buyer IDs; no denominator for this count |
| Data cutoff | How fresh or complete the data is | Snapshot taken 2 Sep; late status changes may revise the result |
| Checks | How you will verify it | Compare with completed orders; inspect repeated IDs and missing buyer IDs |
| Owner and version | Who agrees the definition and when | Product owner; definition agreed before the August report |
The dates and fields here are illustrative. Use the event your decision needs: order creation, payment and completion can fall in different months. Write down how later cancellations or refunds affect the reported metric.
Turn the table into a sentence:
Count distinct non-test buyer accounts with at least one completed order during August, using order completion time in Europe/Amsterdam, on the snapshot taken 2 September.
If your data only identifies accounts, call them accounts. One person can have several accounts, and an account can sometimes be shared. A label like “people” does not solve that identity problem.
The denominator changes the story
Here is a small invented example. Out of 100 eligible accounts, 40 visited the offer page, and 18 of those visitors bought during the same observation window.
| Question | Calculation | Answer |
|---|---|---|
| What share of eligible accounts bought? | 18 / 100 | 18% |
| What share of offer-page visitors bought? | 18 / 40 | 45% |
Both calculations are right. “Conversion was 45%” leaves out the condition that makes it meaningful. If your colleague expects conversion across all eligible accounts, you have answered a different question.
For a conversion rate, check that the numerator is a subset of the denominator, that both use compatible time windows, and that an account is counted at most once. Do not divide this month’s buyers by a different cohort of last month’s visitors and call it conversion without explaining the design.
Give the definition to AI, then check the implementation
Try this instruction after you have agreed the brief:
Restate the metric using the definition above. List any missing fields or assumptions before writing SQL. Show how the query deduplicates accounts and applies the time window. Do not substitute a different event or denominator without asking.
Then inspect the query and a few underlying records. An assistant’s explanation can disagree with its SQL. A complete brief reduces ambiguity; it does not guarantee correct code, complete data or a valid causal conclusion. Use the seven checks for AI-generated numbers before relying on the result.
Practise the conversation in Atterna
In Bigger baskets?, the first Atterna Case, marketing wants to write “the code grows baskets 2.5×” into the December plan. Start with the supplied query, inspect its comparison, and decide what you can defend. Along the way, clarify the request and agree what “basket” means.
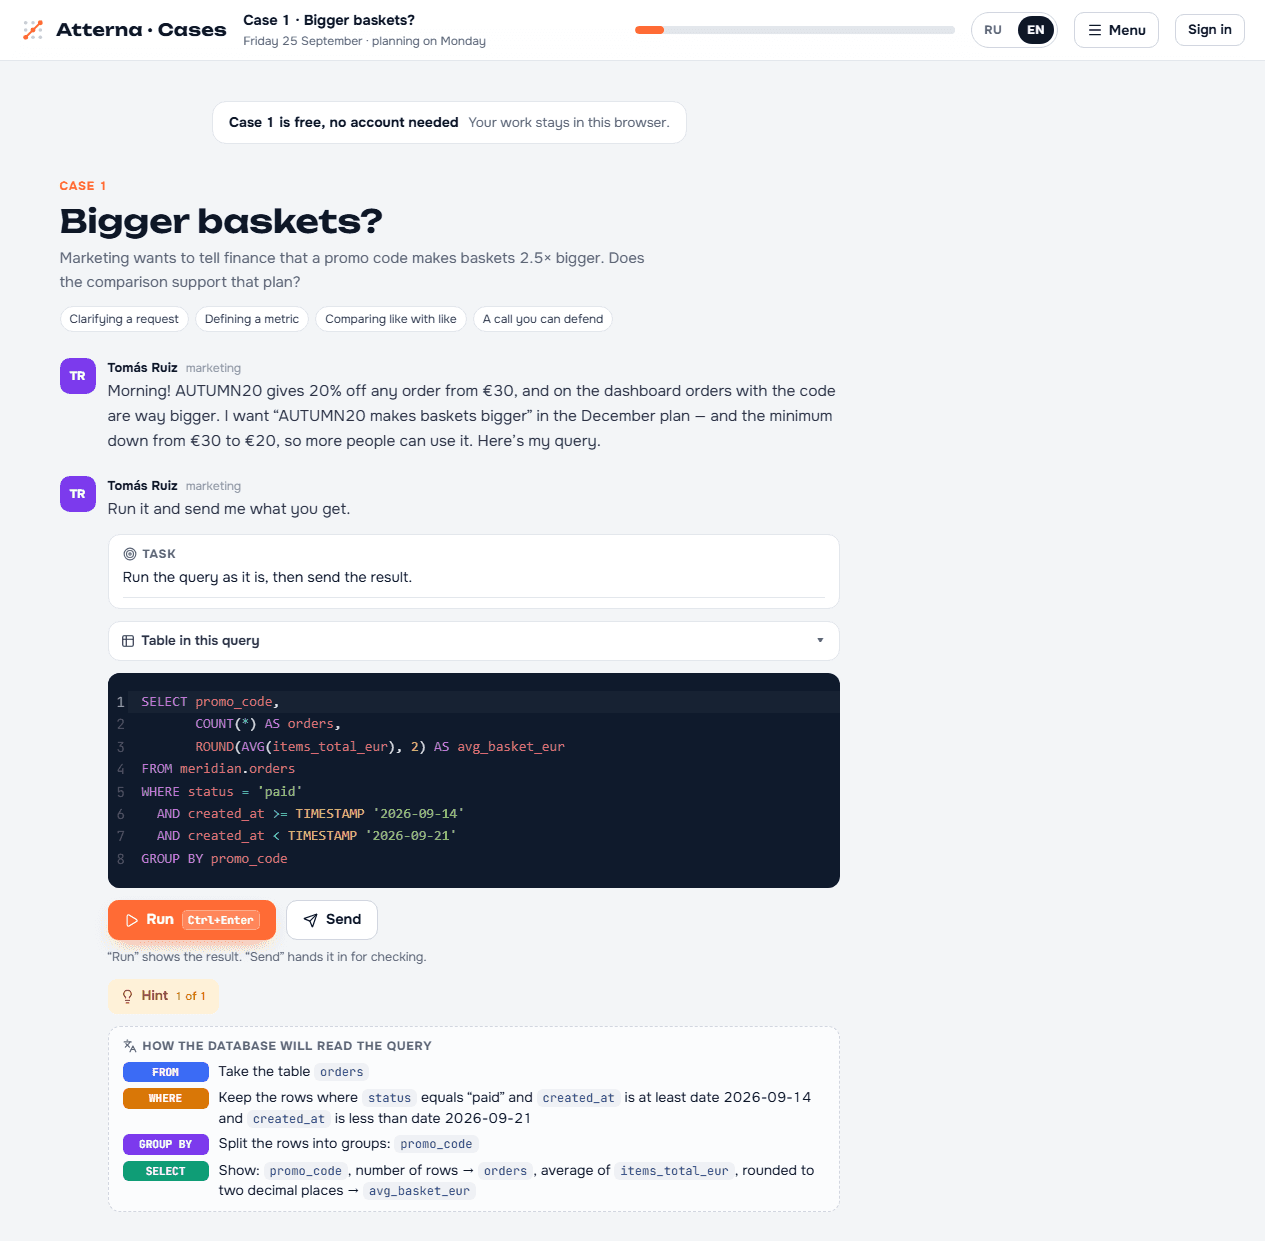
The current opening of Case 1 in English. The first query is supplied; the marketplace and colleagues are fictional.
This is the skill Atterna is built to practise: connecting a business question to the meaning of the data, then checking what the result can support. The workplace story gives you a reason to make those choices; the skill also applies when you read a dashboard or question an AI answer.
Try Bigger baskets? — about 17 minutes, free, no account. The first SQL query is supplied. Check the comparison, then decide what belongs in the plan. Prefer to start without SQL? Wrong Number lets you practise choosing who counts across three requests.
FAQ
What should a metric definition include?
The measure, the entity and unique key, qualifying event, population, period, timezone, exclusions and calculation. Add the denominator for a rate, plus the data cutoff and checks. Record who agreed the definition so future reports can use the same meaning.
What is the first question to ask a stakeholder?
Ask what decision the number will inform. “What will you do differently depending on the result?” helps distinguish a reporting request from a causal question or a decision about future spending.
Is this the same as a semantic layer?
A software semantic layer centralises definitions so tools can reuse them. This template develops the reasoning needed to write and question those definitions. It does not replace a governed metric catalogue or a technical semantic layer.
Can AI define the metric for me?
It can suggest a draft and surface ambiguities. The person responsible for the decision still needs to agree the meaning, and someone must verify that the calculation implements it. A confident explanation is not evidence that the query or data is correct.
Practise this, free
A free account opens hands-on lessons on a realistic marketplace.
- All 10 days of the SQL courseFrom your first table to JOINs and window functions
- Meridian episode 1A full analyst week: the record that wasn’t
- Your first portfolio projectFinished work as a ready GitHub project, with your SQL and charts
- Progress on any deviceYour cheat sheet and review cards go with you
Examples use Meridian, Atterna’s fictional practice marketplace.