Meridian · Atterna Analyst
The dashboard says +75%. Your query says +54%.
That’s episode 1 of Meridian: eight episodes of analyst work on a practice marketplace’s data. You check each number on the data before the team acts on it, then defend the decision.
- about eight hours on the main path
- SQL, plus ready-made Python
- practice data, real traps
Already have an account? Sign in
Episodes 2–8 are in Atterna Analyst: €59 · one-time · early-access price. What’s included
Step 1 of 3
Good morning! The AUTUMN20 promotion ended on Sunday, and the dashboard shows a record: weekly GMV grew 75% compared with a normal week.
Tomás Ruiz: “Best week of the year! Extend and double it” · Decision: Thursday meeting, 11:00
Step 2 of 3
Before anyone calls it a record, let's check: paid orders and GMV for each of the three full weeks — two normal ones and the promo.
SELECT w.week_start, COUNT(*) AS orders, SUM(o.items_total_eur) AS gmv_eurFROM meridian.weeks AS wJOIN meridian.orders AS o ON o.created_at >= w.week_start AND o.created_at < w.week_endWHERE o.status = 'paid'GROUP BY w.week_startORDER BY w.week_start| Week | Paid orders | GMV |
|---|---|---|
| 31 Aug – 6 Sep | 2,625 | €149,812 |
| 7–13 Sep | 2,751 | €150,503 |
| 14–20 Seppromo | 3,289 | €230,967 |
Vera, here are paid orders and GMV for the three weeks. The promo week against an average normal one is +54%. I don't count cancelled orders; they aren't part of GMV.
Hmm. But the dashboard says +75%. Where does the difference come from?
Step 3 of 3
SELECT date_trunc('week', o.created_at) AS week_start, COUNT(DISTINCT o.order_id) AS orders, SUM(o.items_total_eur) AS gmv_eurFROM meridian.orders AS oJOIN meridian.order_items AS i ON i.order_id = o.order_idWHERE o.status = 'paid'GROUP BY 1ORDER BY 1| Week | Dashboard GMV | Correct GMV |
|---|---|---|
| 31 Aug – 6 Sep | €323,431 | €149,812 |
| 7–13 Sep | €313,943 | €150,503 |
| 14–20 Seppromo | €557,752 | €230,967 |
Luka, I think I found it. After the JOIN with line items the order total repeats on every row, and SUM adds it as many times as the order has products. Attached is a week-by-week comparison: how the dashboard counts and how it really is.
So that's it — annoying. In the promo people bought more items at a time, 1.9 line items on average against 1.7, so the dashboard overstated the promo week most of all. I'll fix it now. Good thing this came up before Thursday and not at the meeting itself.
+54%Promo week: +54% vs an average normal week. The dashboard shows +75%.
Be sure of the number before you say it.
Next in episode 1: “A chart for the meeting”, “Reconciling with finance”, “What the platform really earned” and your recommendation for Thursday.
Play episode 1 free with an account →Eight episodes
Each one is a working week: a colleague brings a number, you check it on the data and make the call. Each opens when you finish the one before. In total, about eight hours on the main path.
- 1Record week
A record promo week on the dashboard. Was the record real, and did the week make the platform money?
Free with an account - 2The fast-delivery badge
An A/B test says a badge lifted conversion. Were the groups split fairly, and is the lift more than noise?
Atterna Analyst · €59 - 3Who stays after the first purchase
Retention looks like it collapsed. Who really comes back, and who only came for the discount?
Atterna Analyst · €59 - 4The seller who drags things down
A list of shops to switch off by rating. Is the rule fair to small shops, and can you defend it?
Atterna Analyst · €59 - 5What one delivery costs
Free delivery from €25, or a fee for everyone? What delivering one basket really costs.
Atterna Analyst · €59 - 6A forecast for the sale
How many couriers to book for each day of the spring sale, checked against last year first.
Atterna Analyst · €59 - 7The price of a discount
End the commission discount for big shops? Both sides quote the same test; you read it properly.
Atterna Analyst · €59 - 8Red Monday
Weekly GMV is down 15% and three people blame three causes. Find the step that broke before 12:00.
Atterna Analyst · €59
Real screens
From episode 2, “The fast-delivery badge”: the product team says a badge lifted conversion by 17%.
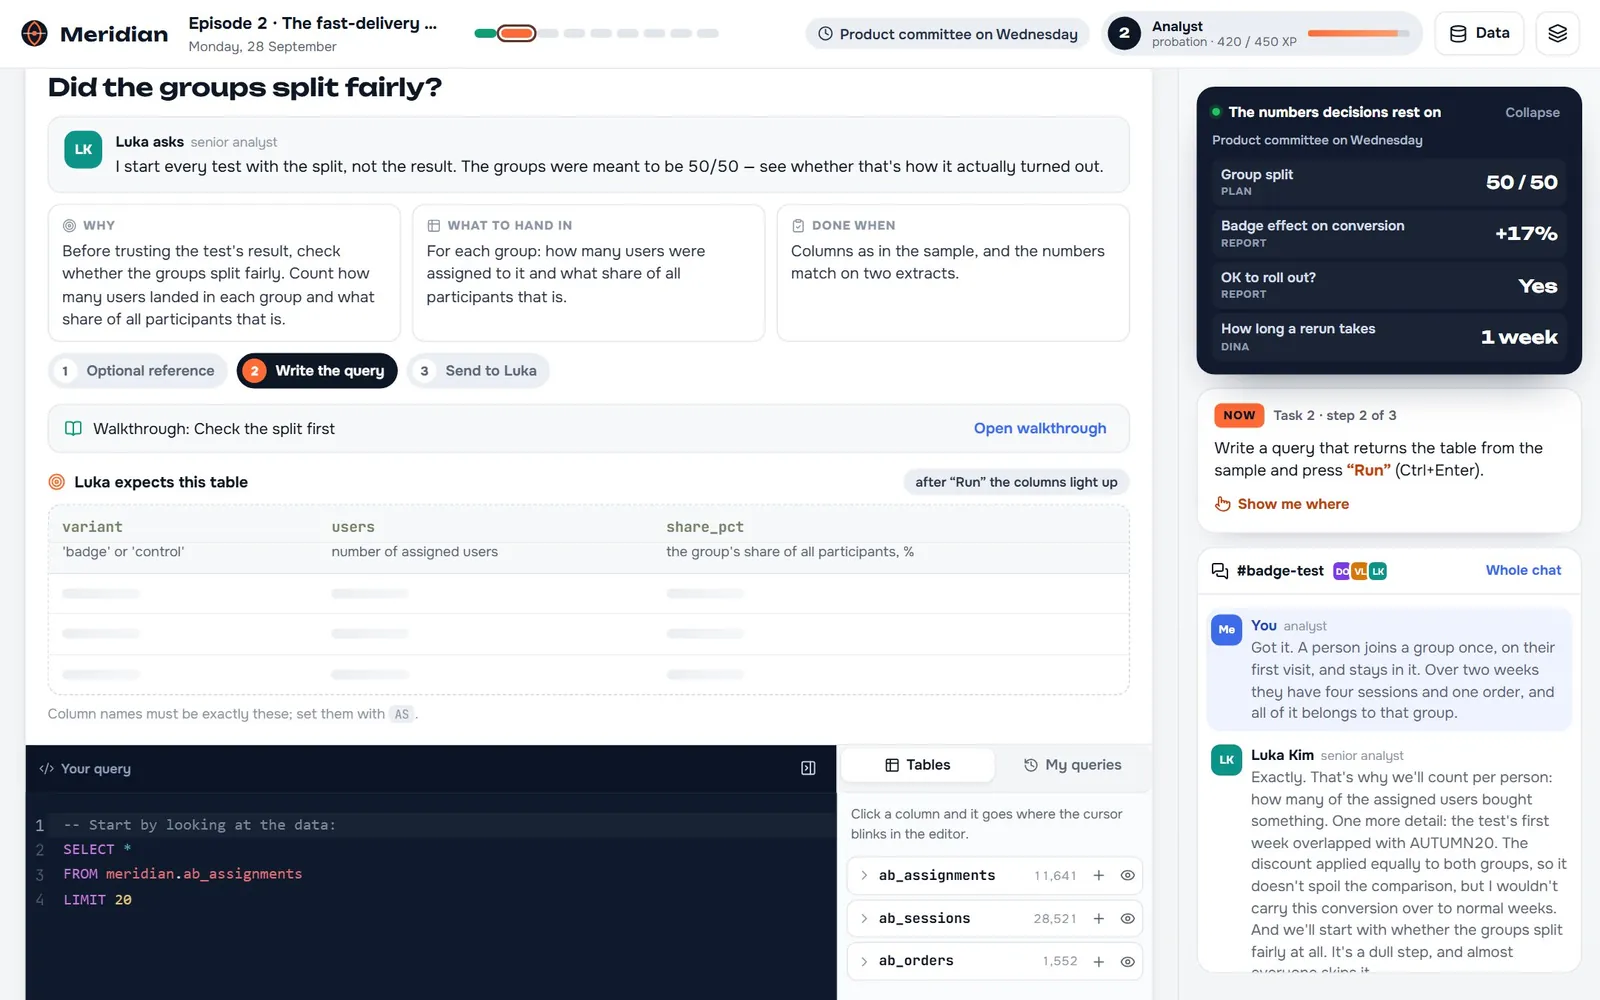
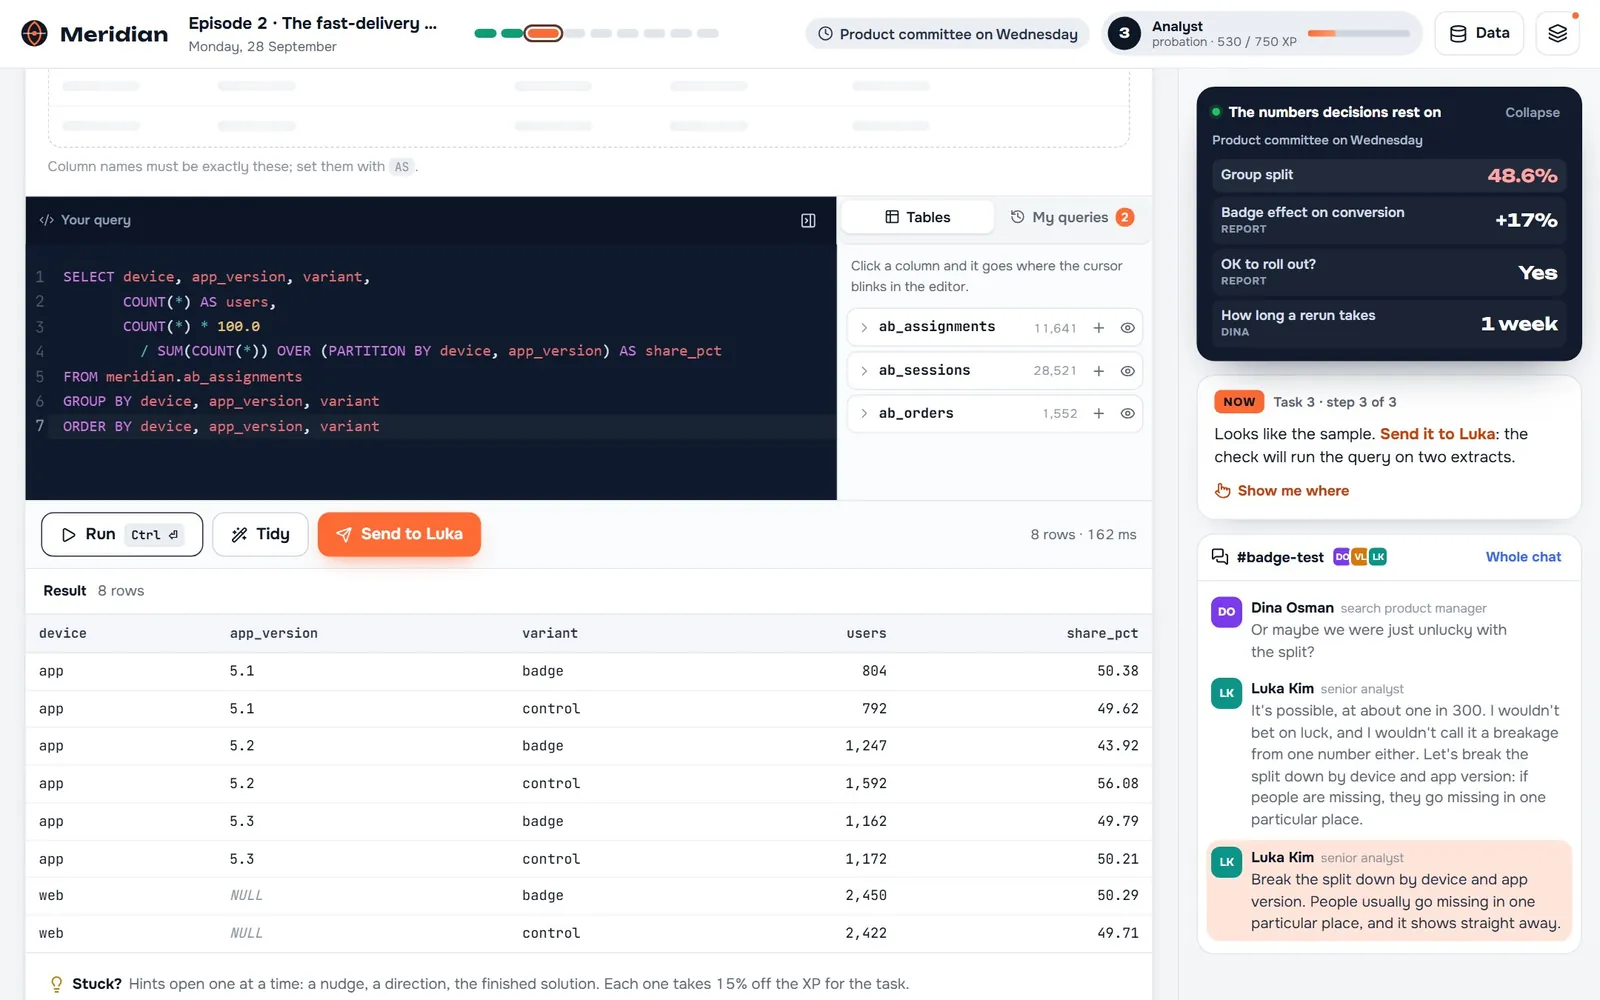
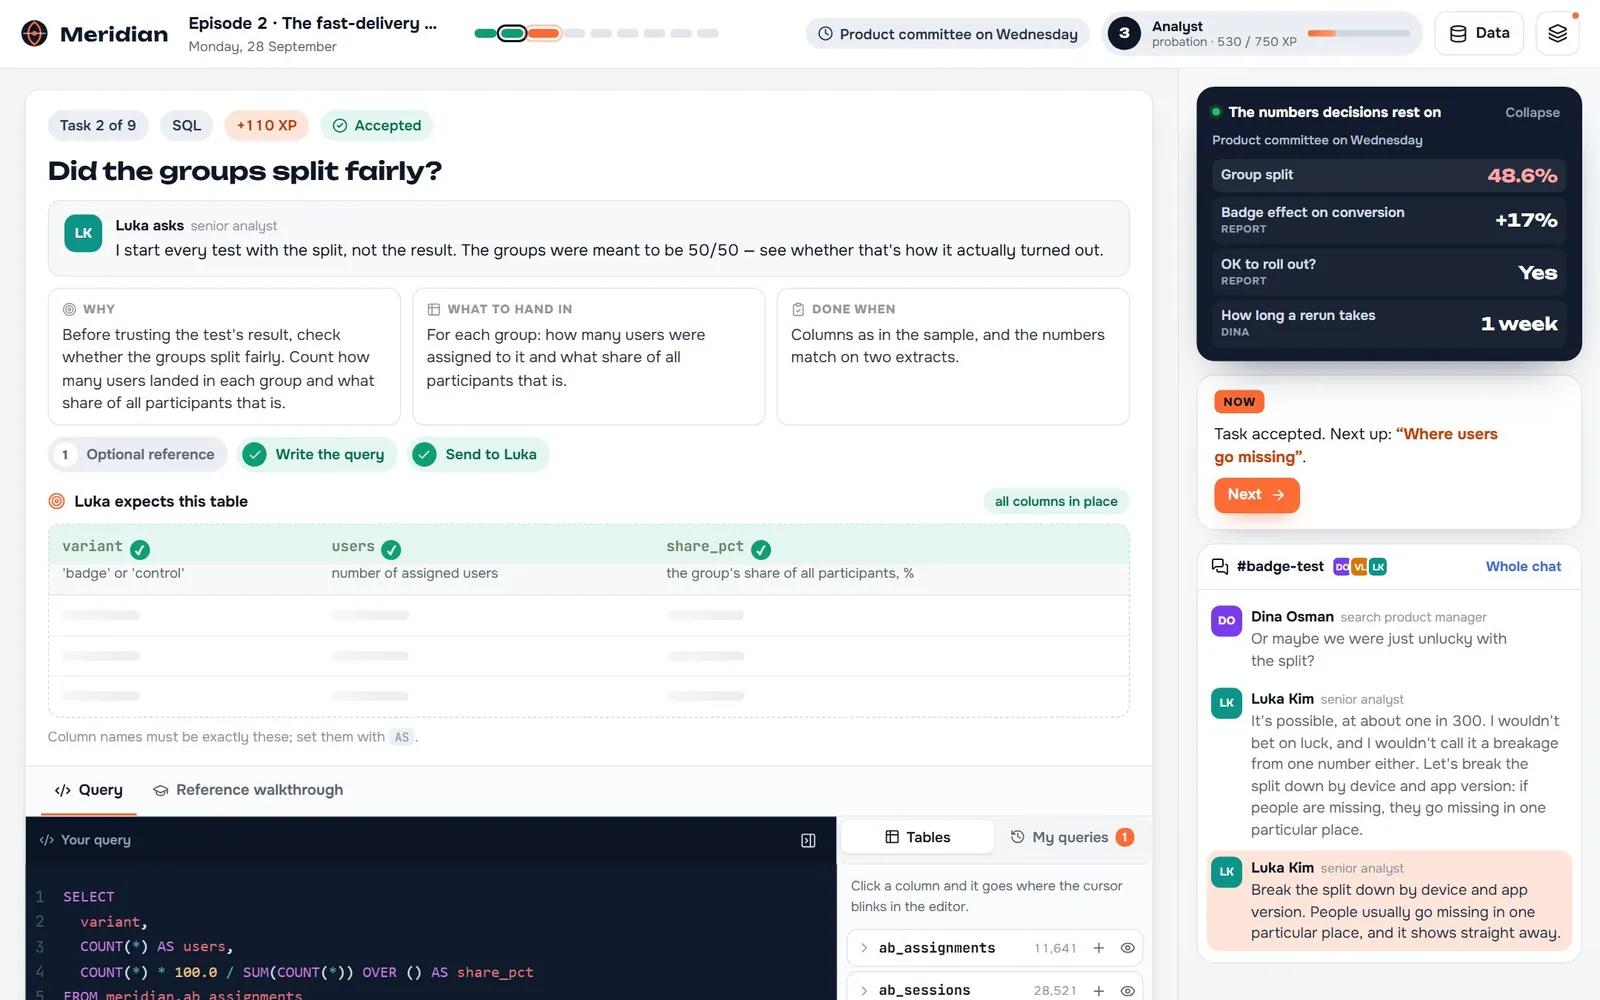
Is it for you?
For people who already answer work questions with data. New to SQL? SQL is free: all 10 days of Start with a free account. You pay only for practice: case rounds (€19) and Meridian (€59).
- Atterna Start (free with an account): SQL from zero
- Case 1: one short decision, free without an account
- Wrong Number: a 3-minute game, no SQL
What’s real and what’s practice
The marketplace, colleagues and records are fictional practice data; the SQL, the checks and the kinds of traps are real. Before you start: How to check numbers an AI gives you.
Atterna Analyst · Meridian
Eight working weeks, about eight hours on the main path
All Meridian episodes, all cases and everything in Foundations, for one payment.
- 8 Meridian episodes
- Metric choice
- A/B tests
- Cohorts
- Forecasts
- Memos the team acts on
- All cases
- Foundations included
€59Atterna Analyst
one-time · early-access price
One-time payment, no subscription · Full refund within 14 days
Or play episode 1 first, free with an accountOr Atterna Foundations · €19